No thumbnails for you
12 Nov 2022
Tags:
bugfix
kernel
tracing
When faced with some systems issue, tracing syscalls usually elucidates us on possible causes. But what if the syscall result itself is elusive?
This was the case with evince-thumbnailer on a Debian system, which was failing to create any thumbnail files:
openat(AT_FDCWD, "/tmp/o.png", O_WRONLY|O_CREAT|O_TRUNC, 0666) = -1 EACCES (Permission denied)
But we could replicate this exact syscall with a python script:
import ctypes as ct
import os

libc = ct.CDLL(None)
syscall = libc.syscall
path = ct.c_char_p("/tmp/o.png".encode('latin-1'))
openat = 257
AT_FDCWD = 0xffffff9c  # (unsigned int32) -100
syscall(openat, AT_FDCWD, path, os.O_WRONLY|os.O_CREAT|os.O_TRUNC, 0o666)
Which works fine, even running with the same user:
openat(AT_FDCWD, "/tmp/o.png", O_WRONLY|O_CREAT|O_TRUNC, 0666) = 3
It’s odd that writing to a public directory would give a “Permission denied” error…
Now, any seasoned sysadmin will likely have a hunch about what is going on, but what if we are bumping into a component we weren’t aware of? Let’s figure it out with a modest debugging session, where we trace the kernel code related to that syscall.
Navigating the kernel source
We can start by getting the source for our distro. The reason we don’t go vanilla is because there might be some distro specific patches that could affect the code path we are hitting.
Afterwards, we configure VSCode to read kernel compile commands, so that following function references takes into account include paths defined by our kernel configuration, which is just copied over from /boot/config-$(uname -r). In our case, we see several “/arch/x86/include/” paths in the generated “compile_commands.json”.
Identifying the syscall handler
If we check the documentation for adding a new syscall, we see a reference to the syscall table file “arch/x86/entry/syscalls/syscall_64.tbl”. If we lookup the syscall number shown by strace, we get the handler name sys_openat from entry 257 common openat sys_openat. The docs also mention these points of interest:
SYSCALL_DEFINEn(xyzzy, ...)for the entry point;- corresponding prototype in “include/linux/syscalls.h”;
With the macro expansion explained in this snippet on “include/linux/syscalls.h”:
/*
 * The asmlinkage stub is aliased to a function named __se_sys_*() which
 * sign-extends 32-bit ints to longs whenever needed. The actual work is
 * done within __do_sys_*().
 */
#ifndef __SYSCALL_DEFINEx
#define __SYSCALL_DEFINEx(x, name, ...)					\
	__diag_push();							\
	__diag_ignore(GCC, 8, "-Wattribute-alias",			\
		      "Type aliasing is used to sanitize syscall arguments");\
	asmlinkage long sys##name(__MAP(x,__SC_DECL,__VA_ARGS__))	\
		__attribute__((alias(__stringify(__se_sys##name))));	\
	ALLOW_ERROR_INJECTION(sys##name, ERRNO);			\
	static inline long __do_sys##name(__MAP(x,__SC_DECL,__VA_ARGS__));\
	asmlinkage long __se_sys##name(__MAP(x,__SC_LONG,__VA_ARGS__));	\
	asmlinkage long __se_sys##name(__MAP(x,__SC_LONG,__VA_ARGS__))	\
	{								\
		long ret = __do_sys##name(__MAP(x,__SC_CAST,__VA_ARGS__));\
		__MAP(x,__SC_TEST,__VA_ARGS__);				\
		__PROTECT(x, ret,__MAP(x,__SC_ARGS,__VA_ARGS__));	\
		return ret;						\
	}								\
	__diag_pop();							\
	static inline long __do_sys##name(__MAP(x,__SC_DECL,__VA_ARGS__))
#endif /* __SYSCALL_DEFINEx */
Grepping for sys_openat leads us to the corresponding entries:
include/linux/syscalls.h:465:asmlinkage long sys_openat(
fs/open.c:1164:static long do_sys_openat2(
Wait, how come there’s only do_sys_openat2? That seems like another syscall:
entry/syscalls/syscall_64.tbl:361:437 common openat2 sys_openat2
Turns out that they share an implementation, we see the defines in “include/linux/syscalls.h”:
SYSCALL_DEFINE4(openat, int, dfd, const char __user *, filename, int, flags,
		umode_t, mode)
{
	// ...
	return do_sys_open(dfd, filename, flags, mode);
}

SYSCALL_DEFINE4(openat2, int, dfd, const char __user *, filename,
		struct open_how __user *, how, size_t, usize)
{
	// ...
	return do_sys_openat2(dfd, filename, &tmp);
}
But the implementation for do_sys_open calls do_sys_openat2:
long do_sys_open(int dfd, const char __user *filename, int flags, umode_t mode)
{
	struct open_how how = build_open_how(flags, mode);
	return do_sys_openat2(dfd, filename, &how);
}
Analysis attempt 1: Using kernel probes
It’s a convenient option, since it doesn’t require us to run a second kernel instance to debug, or add any additional drivers, just tools like bpftrace to show us which kernel functions are hit.
From the previous section, if we run bpftrace -lv '*openat*', we get the expected kprobe:do_sys_openat2. But there are different kinds of probes, including these ones specific to entry and exit from syscalls:
tracepoint:syscalls:sys_enter_openat
tracepoint:syscalls:sys_exit_openat
How to instrument these probes is described in the reference guide.
Since we are interested in observing the call stack when we exit the syscall, you would hope that a sys_exit_openat would be enough… but how do you filter it to just match when the filename is “/tmp/o.png”? You don’t, because args->filename is only available in sys_enter_openat, so we have to use a global variable @match like so:
bpftrace -e '
BEGIN { @match = 0; }
tracepoint:syscalls:sys_enter_openat {
    if (strncmp("/tmp/", str(args->filename), 5) == 0) {
        printf("  path=%s ", str(args->filename));
        @match = 1;
    }
}
tracepoint:syscalls:sys_exit_openat /@match == 1/ {
    printf("retval=%d\n", args->ret);
    @[kstack()] = count();
    @match = 0;
}' -c '/usr/bin/evince-thumbnailer foo.pdf /tmp/o.png'

# Attaching 3 probes...
#   path=/tmp/o.png retval=-13
# @[]: 1
# @match: 0
This isn’t entirely free of issues: what if there’s more than one call to the function we are tracing? The global variable would be set on one of them, but we could be seeing the return value for another call done with other arguments. Luckly, there was only a single call with this error return value being done, which was confirmed by removing the conditional logic.
We can double check that the return value matches the errno symbol EACCES in “include/uapi/asm-generic/errno-base.h”:
#define EACCES 13 /* Permission denied */
Here’s the corresponding call with the python script, which gives a non-error return value:
bpftrace -e '
BEGIN { @match = 0; }
tracepoint:syscalls:sys_enter_openat {
    if (strncmp("/tmp/", str(args->filename), 5) == 0) {
        printf("  path=%s ", str(args->filename));
        @match = 1;
    }
}
tracepoint:syscalls:sys_exit_openat /@match == 1/ {
    printf("retval=%d\n", args->ret);
    @[kstack()] = count();
    @match = 0;
}' -c '/usr/bin/python3.9 /home/fn/syscall.py'

# Attaching 3 probes...
#   path=/tmp/o.png retval=3
# @[]: 1
# @match: 0
Oh, another caveat… the call stack is empty on these probes, so we actually have to use kprobe, along with kretprobe to get the return value:
bpftrace -e '
BEGIN { @match = 0; }
kprobe:do_sys_openat2 {
    if (strncmp("/tmp/", str(arg1), 5) == 0) {
        printf("  path=%s ", str(arg1));
        @[kstack()] = count();
        @match = 1;
    }
}
kretprobe:do_sys_openat2 /@match == 1/ {
    printf("retval=%d\n", retval);
    @match = 0;
}
' -c '/usr/bin/evince-thumbnailer foo.pdf /tmp/o.png'
# Attaching 3 probes...
#   path=/tmp/o.png retval=-13
# @[
#     do_sys_openat2+1
#     __x64_sys_openat+84
#     do_syscall_64+51
#     entry_SYSCALL_64_after_hwframe+97
# ]: 1
# @match: 0
But this call stack isn’t very interesting, since it stops at do_sys_openat2, we actually want to see what happens inside that call. If we look at the source, there are a few open functions called as well:
static long do_sys_openat2(int dfd, const char __user *filename,
			   struct open_how *how)
{
	struct open_flags op;
	int fd = build_open_flags(how, &op);
	struct filename *tmp;

	if (fd)
		return fd;

	tmp = getname(filename);
	if (IS_ERR(tmp))
		return PTR_ERR(tmp);

	fd = get_unused_fd_flags(how->flags);
	if (fd >= 0) {
		struct file *f = do_filp_open(dfd, tmp, &op);
		if (IS_ERR(f)) {
			put_unused_fd(fd);
			fd = PTR_ERR(f);
		} else {
			fsnotify_open(f);
			fd_install(fd, f);
		}
	}
	putname(tmp);
	return fd;
}

struct file *do_filp_open(int dfd, struct filename *pathname,
		const struct open_flags *op)
{
	struct nameidata nd;
	int flags = op->lookup_flags;
	struct file *filp;

	set_nameidata(&nd, dfd, pathname);
	filp = path_openat(&nd, op, flags | LOOKUP_RCU);
	if (unlikely(filp == ERR_PTR(-ECHILD)))
		filp = path_openat(&nd, op, flags);
	if (unlikely(filp == ERR_PTR(-ESTALE)))
		filp = path_openat(&nd, op, flags | LOOKUP_REVAL);
	restore_nameidata();
	return filp;
}
So let’s trace one of those instead:
bpftrace -e '
BEGIN { @match = 0; }
kprobe:path_openat {
    $path = str(((struct filename *)((struct nameidata *)arg0)->name)->name);
    if (strncmp("/tmp/", $path, 5) == 0) {
        printf("  path=%s ", $path);
        @[kstack()] = count();
        @match = 1;
    }
}
kretprobe:path_openat /@match == 1/ {
    printf("retval=%d\n", retval);
    @match = 0;
}
' -c '/usr/bin/evince-thumbnailer foo.pdf /tmp/o.png'
# Attaching 3 probes...
#   path=/tmp/o.png retval=-13
# @[
#     path_openat+1
#     do_filp_open+136
#     do_sys_openat2+155
#     __x64_sys_openat+84
#     do_syscall_64+51
#     entry_SYSCALL_64_after_hwframe+97
# ]: 1
# @match: 0
Now we know path_openat is reached, which has all these calls:
static struct file *path_openat(struct nameidata *nd,
			const struct open_flags *op, unsigned flags)
{
	struct file *file;
	int error;

	file = alloc_empty_file(op->open_flag, current_cred());
	if (IS_ERR(file))
		return file;

	if (unlikely(file->f_flags & __O_TMPFILE)) {
		error = do_tmpfile(nd, flags, op, file);
	} else if (unlikely(file->f_flags & O_PATH)) {
		error = do_o_path(nd, flags, file);
	} else {
		const char *s = path_init(nd, flags);
		while (!(error = link_path_walk(s, nd)) &&
		       (s = open_last_lookups(nd, file, op)) != NULL)
			;
		if (!error)
			error = do_open(nd, file, op);
		terminate_walk(nd);
	}
	if (likely(!error)) {
		if (likely(file->f_mode & FMODE_OPENED))
			return file;
		WARN_ON(1);
		error = -EINVAL;
	}
	fput(file);
	if (error == -EOPENSTALE) {
		if (flags & LOOKUP_RCU)
			error = -ECHILD;
		else
			error = -ESTALE;
	}
	return ERR_PTR(error);
}
It still isn’t very clear where -EACCES is being returned… After adapting the above snippet to trace link_path_walk and then terminate_walk, we confirm both calls are reached, so we know we enter that else-block, but link_path_walk doesn’t set the expected error, so it must be set by do_open.
Now we reach the fun part: there are no probes for do_open. There wasn’t anything special about it to not have probes, but this also happened with a few other functions as well. Perhaps it’s inlined? Let’s confirm with a disassembly.
This was still done with a live image, for which the linux binary was at /boot/vmlinuz-$(uname -r), which is stripped from symbols. There are some scripts to retrieve symbols and add them to a disassembly, but for now we just want to extract vmlinuz and get the symbols as root with cat /proc/kallsyms. Since the live image is running with kernel address space layout randomization (KASLR), we need to translate the address of path_openat with these steps:
- Add
kaddr("path_openat")to our bpftrace snippet, which outputs this address:9EEE5390 - Find out the virtual base address of the live image by grepping for
_text(a label set at the start of the.textsection) in the dumped/proc/kallsyms:ffffffff9ec00000 T _text - Find out the base address of the binary with
objdump -tC vmlinux | grep _text:ffffffff81000000 g .text 0000000000000000 _text - Translate the live address of
path_openat:0xffffffff9eee5390 - 0xffffffff9ec00000 + 0xffffffff81000000 = 0xffffffff812e5390
Which gives us this decompilation:
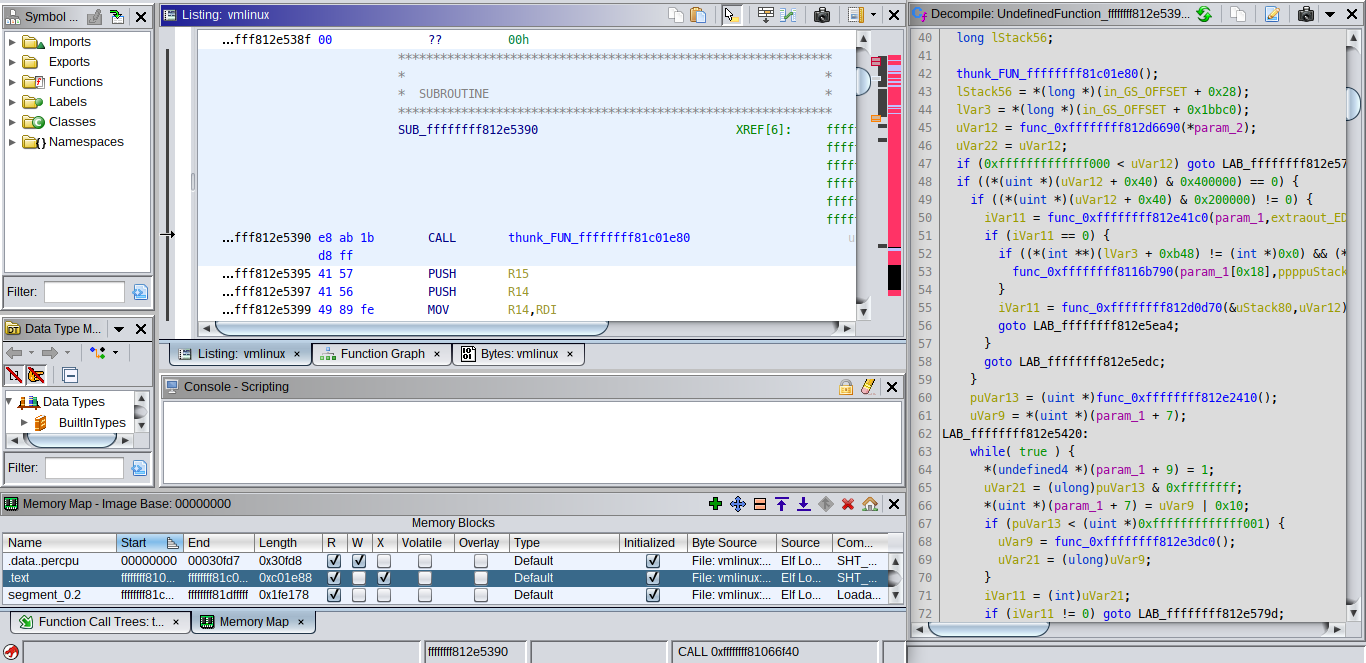
Even without adding symbols, we already see a much larger number of calls in this function than the ones in the source, and we can lookup some of the constants being compared to confirm that do_open is inlined.
EDIT: Another less stubborn approach would be to disable ASLR and use debugging symbols with gdb’s disassemble/m.
So, how do we trace an inlined function? We could add probes to its callees, but some of them were also inlined. Maybe bisect using offsets like kprobe:path_openat+7, but no luck there:
Can't check if kprobe is in proper place (compiled without (k|u)probe offset support):
    /usr/lib/debug/boot/vmlinux-5.10.0-18-amd64:path_openat+7
Alright, let’s compile a kernel then.
At this point, I decided to switch approaches and instead prepare it for remote debugging, since we would have more context in a gdb session anyway, and hopefully bump into less caveats…
Analysis attempt 2: Debugging the kernel
There are several options on how to setup this. Since I already had a VirtualBox VM with Debian installed, I went with kgdb over a serial port, which involved the following steps:
- On VirtualBox, configure serial port via host pipe “/tmp/vboxS0”;
- On the guest, bootstrap from currently loaded modules:
make localmodconfig - Prepare the generated “.config” not only for kgdb, but also to generate “vmlinux-gdb.py”, which allows gdb to correctly resolve kernel addresses and symbols:
CONFIG_FRAME_POINTER=y CONFIG_GDB_SCRIPTS=y CONFIG_KGDB=y CONFIG_KGDB_SERIAL_CONSOLE=y CONFIG_STRICT_KERNEL_RWX=n - Build kernel:
make bzImage make modules make modules_install make install - If you didn’t build in a shared folder, then copy over build artifacts to host;
- Reboot guest, then edit GRUB entry to add boot parameters (on the line with “linux /boot/vmlinuz-…”):
kgdboc=ttyS0,115200 nokaslr
After starting the graphical session, we make the guest wait for a remote gdb connection:
echo g > /proc/sysrq-trigger
Now we connect from the host with our gdb client:
gdb \
    -ex 'set serial baud 115200' \
    -ex 'target remote /tmp/vboxS0' \
    -x /usr/src/linux-source-5.10/vmlinux-gdb.py \
    /usr/src/linux-source-5.10/vmlinux
For the gdb frontend, I use gdb-dashboard, since it makes less assumptions about the gdb server, therefore less possible issues than fancier frontends like pwndbg. It shows the following panes:
dashboard -layout assembly !breakpoints !expressions !history memory registers source stack !threads variables
In our session, we set a conditional breakpoint inside the function of interest, so that it only stops execution when the filename to open is our output file:
break *path_openat
condition 1 $_streq((char *)nd->name->name, "/tmp/o.png")
After running the evince-thumbnailer command on the guest, the breakpoint is hit, and we can step through the function. However, there’s also caveats here…
Sometimes, before a call instruction is skipped, we get a context switch:
0xffffffff812d4366 path_openat+70 call   0xffffffff812c5c50 <alloc_empty_file>

>>> ni
Warning:
Cannot insert breakpoint 0.
Cannot access memory at address 0x0
After another ni, we are now… back to the function start in another thread?
Thread 145 received signal SIGTRAP, Trace/breakpoint trap.
[Switching to Thread 896]
0xffffffff812d4327 in path_openat (nd=nd@entry=0xffffc900023e3dd0, op=op@entry=0xffffc900023e3ee4, flags=flags@entry=65) at fs/namei.c:3346
3346    fs/namei.c: No such file or directory.
   0xffffffff812d4325 <path_openat+5>:  41 57   push   %r15
=> 0xffffffff812d4327 <path_openat+7>:  41 56   push   %r14
Yet the filename doesn’t match our condition:
>>> p nd->name->name
$5 = 0xffff88803504c020 "/proc/1095/cmdline"
Whatever, let’s switch back to our thread:
>>> thread 162
[Switching to thread 162 (Thread 1095)]
#0  0x0000000000000000 in fixed_percpu_data ()
=> 0x0000000000000000 <fixed_percpu_data+0>:    Cannot access memory at address 0x0

>>> ni
Thread 145 received signal SIGTRAP, Trace/breakpoint trap.
[Switching to Thread 896]
Yet again in the wrong thread… a workaround is to just set another conditional breakpoint somewhere after the place the context switch occurred:
>>> b *(path_openat+75)
Breakpoint 2 at 0xffffffff812d436b: file fs/namei.c, line 3350.
>>> condition 2 $_streq((char *)nd->name->name, "/tmp/o.png")
>>> c
EDIT: These context switches are likely due to interrupts, which can be avoided with handle SIGINT nostop pass.
Definitely do not set scheduler-locking step, unless you like core dumps…
/build/gdb-Nav6Es/gdb-10.1/gdb/infrun.c:7249: internal-error:
    int switch_back_to_stepped_thread(execution_control_state*):
    Assertion `!schedlock_applies (tp)' failed.
...
Aborted (core dumped)
Even a simple sanity check isn’t devoid from issues:
>>> lx-symbols
loading vmlinux
/build/gdb-Nav6Es/gdb-10.1/gdb/dwarf2/frame.c:1085: internal-error: Unknown CFA rule.
...
Aborted (core dumped)
Luckly, this doesn’t affect the disassembly itself, so we can tell which functions are being called with disass /r path_openat. For example, here’s a snippet surronding the else-block where we saw do_open inlined:
0xffffffff812d4492 <+370>:   a9 00 00 18 00  test   $0x180000,%eax
0xffffffff812d4497 <+375>:   0f 84 07 07 00 00       je     0xffffffff812d4ba4 <path_openat+2180>
0xffffffff812d449d <+381>:   a9 00 00 10 00  test   $0x100000,%eax
0xffffffff812d44a2 <+386>:   0f 84 15 07 00 00       je     0xffffffff812d4bbd <path_openat+2205>
0xffffffff812d44a8 <+392>:   40 f6 c5 40     test   $0x40,%bpl
0xffffffff812d44ac <+396>:   0f 85 99 06 00 00       jne    0xffffffff812d4b4b <path_openat+2091>
0xffffffff812d44b2 <+402>:   41 f6 46 38 02  testb  $0x2,0x38(%r14)
0xffffffff812d44b7 <+407>:   0f 84 3c 08 00 00       je     0xffffffff812d4cf9 <path_openat+2521>
0xffffffff812d44bd <+413>:   49 8b 46 08     mov    0x8(%r14),%rax
0xffffffff812d44c1 <+417>:   8b 00   mov    (%rax),%eax
0xffffffff812d44c3 <+419>:   25 00 00 70 00  and    $0x700000,%eax
0xffffffff812d44c8 <+424>:   3d 00 00 20 00  cmp    $0x200000,%eax
0xffffffff812d44cd <+429>:   0f 85 0c 0e 00 00       jne    0xffffffff812d52df <path_openat+4031>
0xffffffff812d44d3 <+435>:   41 f6 47 46 10  testb  $0x10,0x46(%r15)
0xffffffff812d44d8 <+440>:   0f 84 b3 0a 00 00       je     0xffffffff812d4f91 <path_openat+3185>
0xffffffff812d44de <+446>:   81 e5 ff fd ff ff       and    $0xfffffdff,%ebp
0xffffffff812d44e4 <+452>:   31 db   xor    %ebx,%ebx
0xffffffff812d44e6 <+454>:   44 89 ee        mov    %r13d,%esi
0xffffffff812d44e9 <+457>:   89 ea   mov    %ebp,%edx
0xffffffff812d44eb <+459>:   4c 89 f7        mov    %r14,%rdi
0xffffffff812d44ee <+462>:   e8 8d e1 ff ff  call   0xffffffff812d2680 <may_open>
Which maps to this snippet in do_open:
if (!(file->f_mode & (FMODE_OPENED | FMODE_CREATED))) { // test $0x180000,%eax
    // ...
}
if (!(file->f_mode & FMODE_CREATED)) // test $0x100000,%eax
    // ...
if (open_flag & O_CREAT) { // test $0x40,%bpl
    // ...
}
if ((nd->flags & LOOKUP_DIRECTORY) && !d_can_lookup(nd->path.dentry)) // testb $0x2,0x38(%r14) ; left side of expression
    // ...

// ...
error = may_open(&nd->path, acc_mode, open_flag);
As we step through the function, inlined parts are marked in the disassembly, such as this part after calling link_path_walk:
0xffffffff812d43d1 path_openat+177 call   0xffffffff812d2db0 <link_path_walk>
0xffffffff812d43d6 path_openat+182 mov    %eax,%r13d
0xffffffff812d43d9 path_openat+185 test   %r13d,%r13d
0xffffffff812d43dc open_last_lookups-6  jne    0xffffffff812d4723 <path_openat+1027>
0xffffffff812d43e2 open_last_lookups+0  mov    0x48(%r15),%edx
0xffffffff812d43e6 open_last_lookups+4  mov    0x38(%r15),%eax
Recall that we are looking for whatever sets error = -13 (which has unsigned value 0xfffffff3). Eventually we step up to that point, as we can see from the return value stored in rax after calling security_path_mknod:
Having to step until we find the expected return value isn’t very efficient. In theory, we could set a conditional watchpoint in gdb like watch $rax == 0xfffffff3. In practice, this just hangs both the gdb client as well as the guest VM, to the point where manually stepping is faster. It might be related with the implementation itself, since we do hit more common values, such as watch $rax == 0.
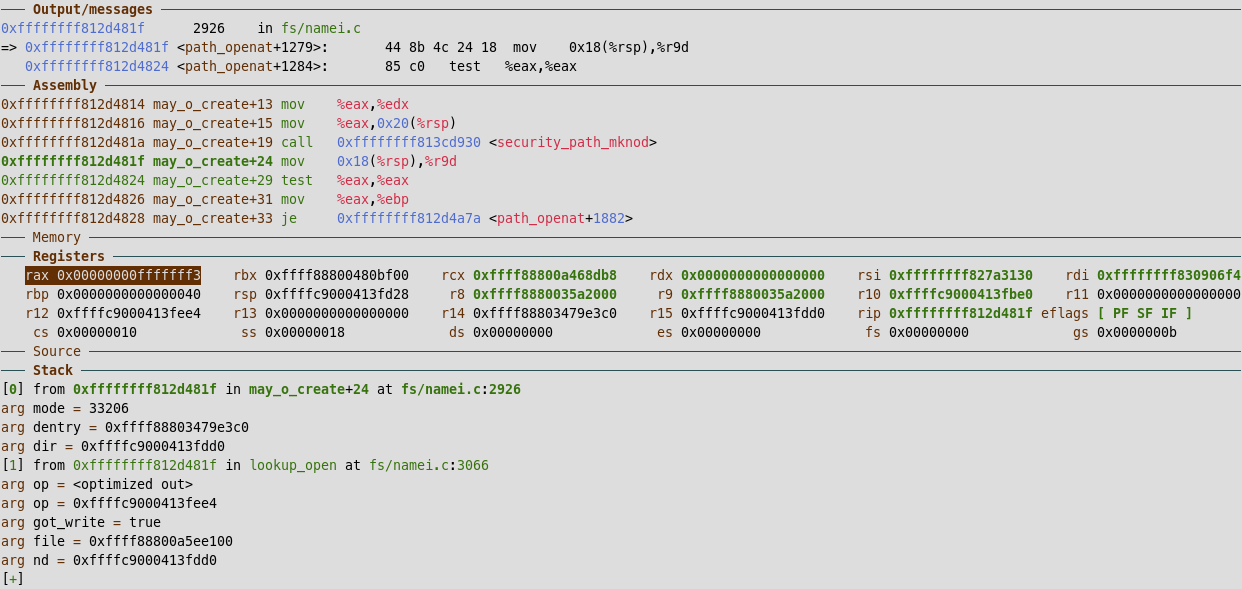
After running evince-thumbnailer again, we now step inside security_path_mknod, where we see an indirect call:
0xffffffff813cd94b security_path_mknod+27 mov    0xdf6ff6(%rip),%rbx        # 0xffffffff821c4948 <security_hook_heads+328>
0xffffffff813cd96e security_path_mknod+62 call   *0x18(%rbx)
=>
0xffffffff8141a220 apparmor_path_mknod+0 nopl   0x0(%rax,%rax,1)
At this point, we have some funny names to search for, leading us to conclude that we are dealing with mandatory access control. But let’s go a bit further, to see where the difference appears between commands.
Here’s the source for some hit functions in “security/apparmor/lsm.c”:
static int apparmor_path_mknod(const struct path *dir, struct dentry *dentry,
			       umode_t mode, unsigned int dev)
{
	return common_perm_create(OP_MKNOD, dir, dentry, AA_MAY_CREATE, mode);
}

static int common_perm_create(const char *op, const struct path *dir,
			      struct dentry *dentry, u32 mask, umode_t mode)
{
	struct path_cond cond = { current_fsuid(), mode };

	if (!path_mediated_fs(dir->dentry))
		return 0;

	return common_perm_dir_dentry(op, dir, dentry, mask, &cond);
}

static int common_perm_dir_dentry(const char *op, const struct path *dir,
				  struct dentry *dentry, u32 mask,
				  struct path_cond *cond)
{
	struct path path = { .mnt = dir->mnt, .dentry = dentry };

	return common_perm(op, &path, mask, cond);
}

static int common_perm(const char *op, const struct path *path, u32 mask,
		       struct path_cond *cond)
{
	struct aa_label *label;
	int error = 0;

	label = __begin_current_label_crit_section();
	if (!unconfined(label))
		error = aa_path_perm(op, label, path, 0, mask, cond);
	__end_current_label_crit_section(label);

	return error;
}
The interesting part is in common_perm, where we see that if there’s an “unconfined” label, no further validations are done, otherwise the label is validated by aa_path_perm.
In our case, we can step up to that call:
0xffffffff8141a341 common_perm+180 call 0xffffffff8141d5c0 <aa_path_perm>
There are some details about the operation, such as the requested mask and the path to validate:
>>> p op
$23 = 0xffffffff8212ff06 "mknod"
>>> p *path->dentry
$24 = {
  d_flags = 524352,
  d_parent = 0xffff8880345a59c0,
  d_name = {
    name = 0xffff8880085270f8 "o.png"
  },
  d_inode = 0x0 <fixed_percpu_data>,
  d_iname = "o.png", '\000' <repeats 26 times>,
>>> p mask
$25 = 16
>>> p *cond
$27 = {
  uid = {
    val = 1000
  },
  mode = 33206
}
In particular, the apparmor profile hierarchical name (hname) is specific to evince-thumbnailer:
>>> p *label
$21 = {
  count = {
    refcount = {
      refs = {
        counter = 114
      }
    }
  },
  node = {
    __rb_parent_color = 18446612682279220920,
    rb_right = 0x0 <fixed_percpu_data>,
    rb_left = 0x0 <fixed_percpu_data>
  },
  rcu = {
    next = 0x0 <fixed_percpu_data>,
    func = 0x0 <fixed_percpu_data>
  },
  proxy = 0xffff88800e47ced0,
  hname = 0xffff888009fe8304 "/usr/bin/evince-thumbnailer",
  flags = 768,
  secid = 15,
  size = 1,
  vec = 0xffff88800c77eb00
}
If we compare with the python script, we see it has profile “unconfined”, which means no restrictions are applied, which is why the syscall passed for it:
>>> p *label
$32 = {
  count = {
    refcount = {
      refs = {
        counter = 1943
      }
    }
  },
  node = {
    __rb_parent_color = 18446612682126247608,
    rb_right = 0x0 <fixed_percpu_data>,
    rb_left = 0x0 <fixed_percpu_data>
  },
  rcu = {
    next = 0x0 <fixed_percpu_data>,
    func = 0x0 <fixed_percpu_data>
  },
  proxy = 0xffff8880034510b0,
  hname = 0xffff8880034510a4 "unconfined",
  flags = 666,
  secid = 2,
  size = 1,
  vec = 0xffff88800359c700
}
Finally, we can see the actual place where the error is set:
int __aa_path_perm(const char *op, struct aa_profile *profile, const char *name,
		   u32 request, struct path_cond *cond, int flags,
		   struct aa_perms *perms)
{
	int e = 0;

	if (profile_unconfined(profile))
		return 0;
	aa_str_perms(profile->file.dfa, profile->file.start, name, cond, perms);
	if (request & ~perms->allow)
		e = -EACCES;
	return aa_audit_file(profile, perms, op, request, name, NULL, NULL,
			     cond->uid, NULL, e);
}
Seems like the rule matching is done with some deterministic finite automaton, but we can leave those internals for another time. The relevant part is in aa_str_perms: callee aa_dfa_match computes the dfa state for the given filename, then aa_compute_fperms lookups the given state in the accept table of the dfa, and returns a permission set of 0x244 == AA_MAY_GETATTR | AA_MAY_OPEN | AA_MAY_READ, which lacks a AA_MAY_CREATE needed for mknod.
Updating the profile
Our mandatory access control is probably being a bit too restrictive in what the thumbnailer should be allowed to write.
We can find previous attempts at generating thumbnails with grep audit /var/log/kern.log, which were being done under path “$HOME/.cache/thumbnails/”:
Nov 12 18:45:39 mnutop kernel: [594720.105420] audit: type=1400 audit(1668278739.933:2214):
    apparmor="DENIED"
    operation="mknod"
    profile="/usr/bin/evince-thumbnailer"
    name="/home/fn/.cache/thumbnails/normal/7e1c6e23bd26e7cd94b85849dd6d1b19.png"
    pid=1685096
    comm="evince-thumbnai"
    requested_mask="c"
    denied_mask="c"
    fsuid=1000
    ouid=1000
Our profile of interest is stored under “/etc/apparmor.d/usr.bin.evince”. Let’s allow it to write under the user’s thumbnails directory, by adding this rule:
owner @{HOME}/.cache/thumbnails/** rw,
After reloading with apparmor_parser -r /etc/apparmor.d/usr.bin.evince, we now have thumbnails appearing in our file manager.
Ta-da
It might feel silly to go a long way to identify an issue that was evident in audit logs, but for all the times where logs can’t save you, it’s nice to know where to look under the cover.